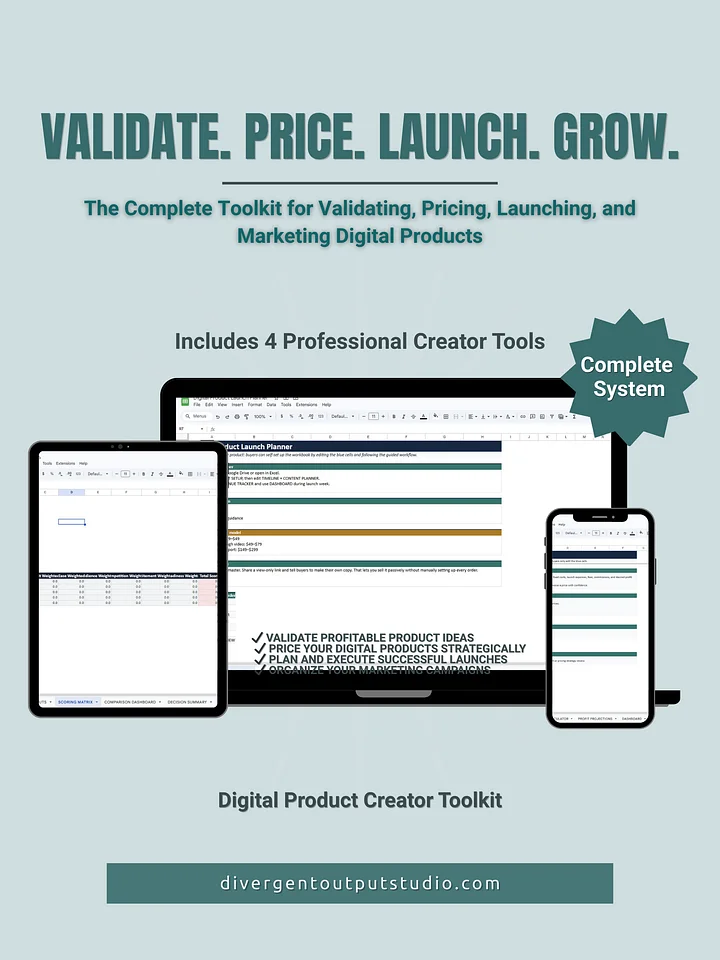
Business KPI Dashboard — Google Sheets Template by Divergent Output Studio
Track the numbers that drive your business forward.
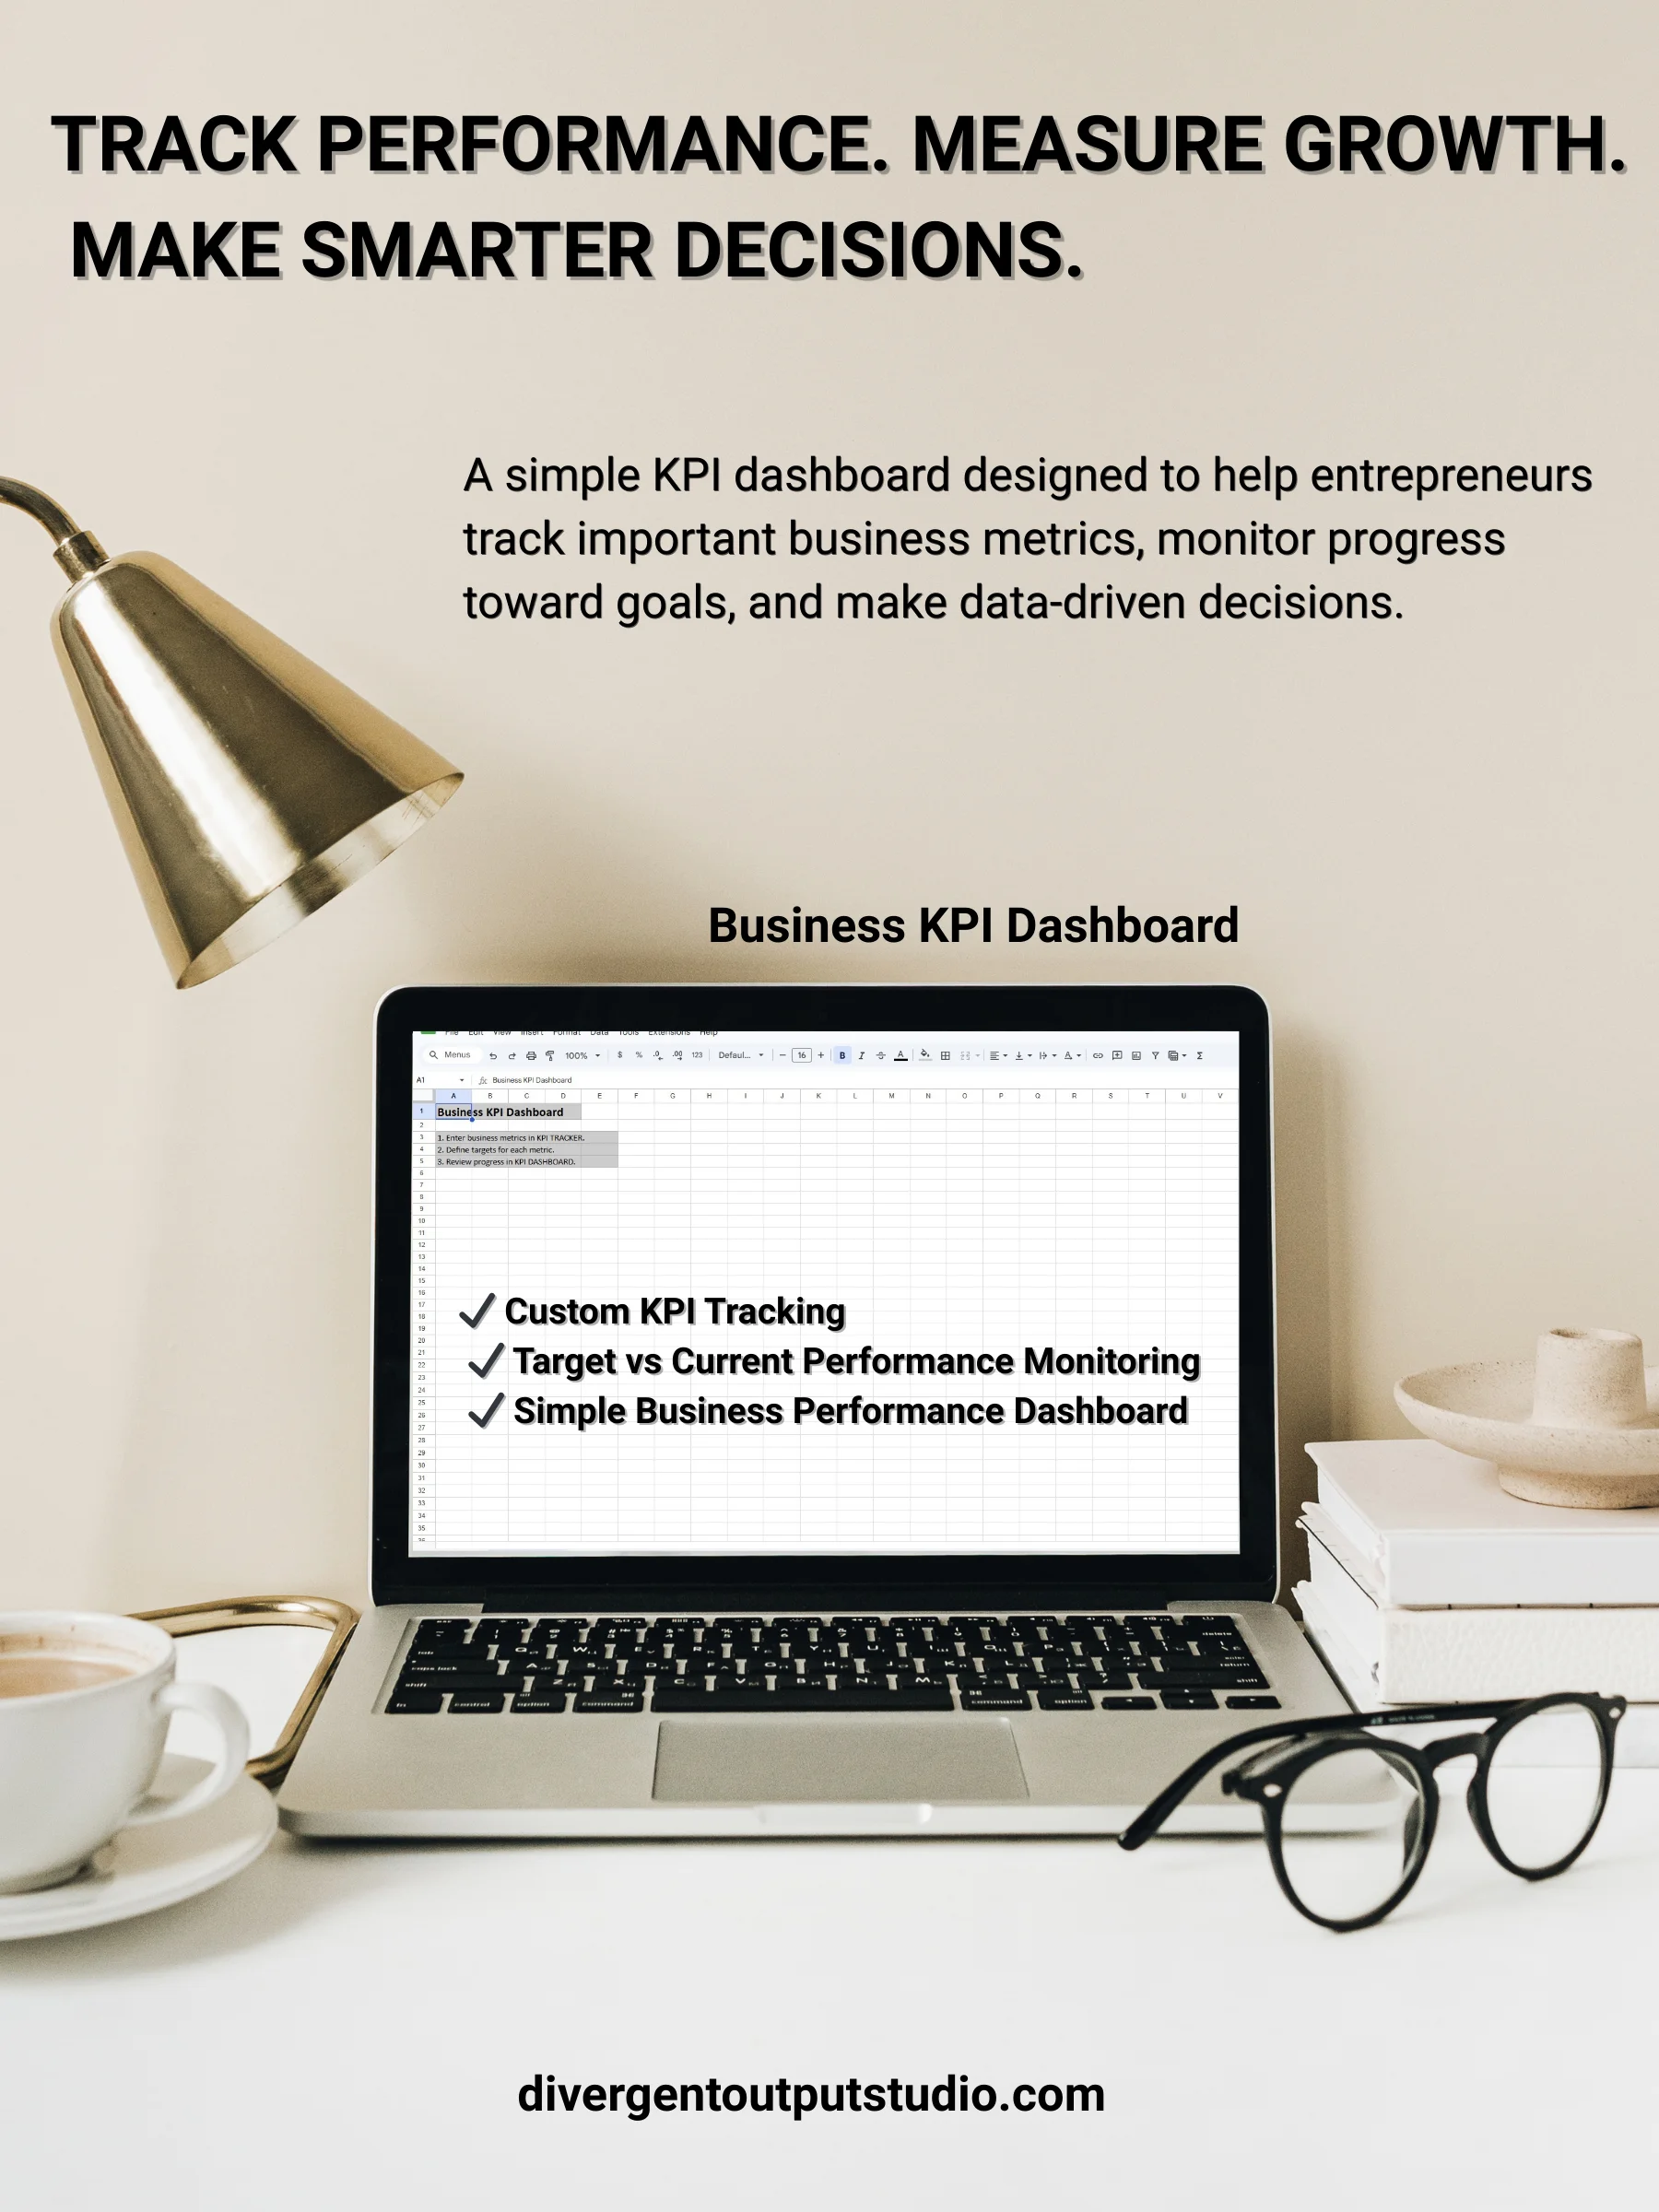
Most entrepreneurs know they should be tracking their business metrics — but between scattered spreadsheets, inconsistent reporting, and the daily demands of running a business, it rarely happens consistently. The Business KPI Dashboard gives you a simple, structured system to monitor your most important performance indicators, evaluate progress toward goals, and make data-driven decisions.
This Google Sheets dashboard is designed for business owners and creators who want a clean, effective way to track their KPIs — without the cost of analytics software or the hassle of building a tracking system from scratch.
What's Included:
- KPI Tracker — Enter and manage your business metrics with fields for metric name, category, target value, current value, auto-calculated progress, and notes. Organize metrics by business area such as Sales, Marketing, Operations, Finance, or Customer Growth.
- Performance Indicators — Color-coded progress tracking (Green, Yellow, Red) so you can instantly see which KPIs are on target, approaching target, or need attention.
- KPI Dashboard — An automatic performance summary showing total KPIs tracked, KPIs on target, KPIs below target, and average progress across all metrics.
- Start Here Guide — In-app instructions with examples of common business KPIs to help you decide which metrics to track.
- User Guide — A detailed setup and usage guide covering every tab, field, and feature in the dashboard.
How It Works:
After purchase, you'll receive a link that automatically saves a copy of the dashboard to your Google Drive. No downloads, no software to install — just open and start entering your data. The dashboard uses a simple color-coded system so you always know where to input your metrics and which cells update automatically.
Built for entrepreneurs who want to:
- Consolidate key business metrics into a single organized view
- Set clear targets and measure progress with auto-calculated percentages
- Instantly identify which KPIs are on track and which need attention
- Make strategic decisions backed by real data instead of guesswork
Track metrics like:
Monthly revenue, new customers, website traffic, email subscribers, sales conversion rate, customer retention rate, average order value, and any other KPI that reflects your business performance.
This is a digital product. You will receive a PDF with your access link and user guide upon purchase. A Google account is required to use this product.